HTTP and HTTPS
Status code, response time, redirects and a required string in the body.
Checks, servers and communication
Every feature with what it actually does – and where its limits are.
Five check types, confirmed outages, one history.
Uptimo checks not only whether a service answers but what it answers. Every monitor carries an interval, a timeout, an expected status code and optionally a string that must appear in the response — an error page served with status 200 does not pass as healthy.
Status code, response time, redirects and a required string in the body.
Reachability and latency for hosts, routers and anything with an IP.
Database, mail server or your own service: does the port answer at all?
Resolution and zone availability, before customers see an empty page.
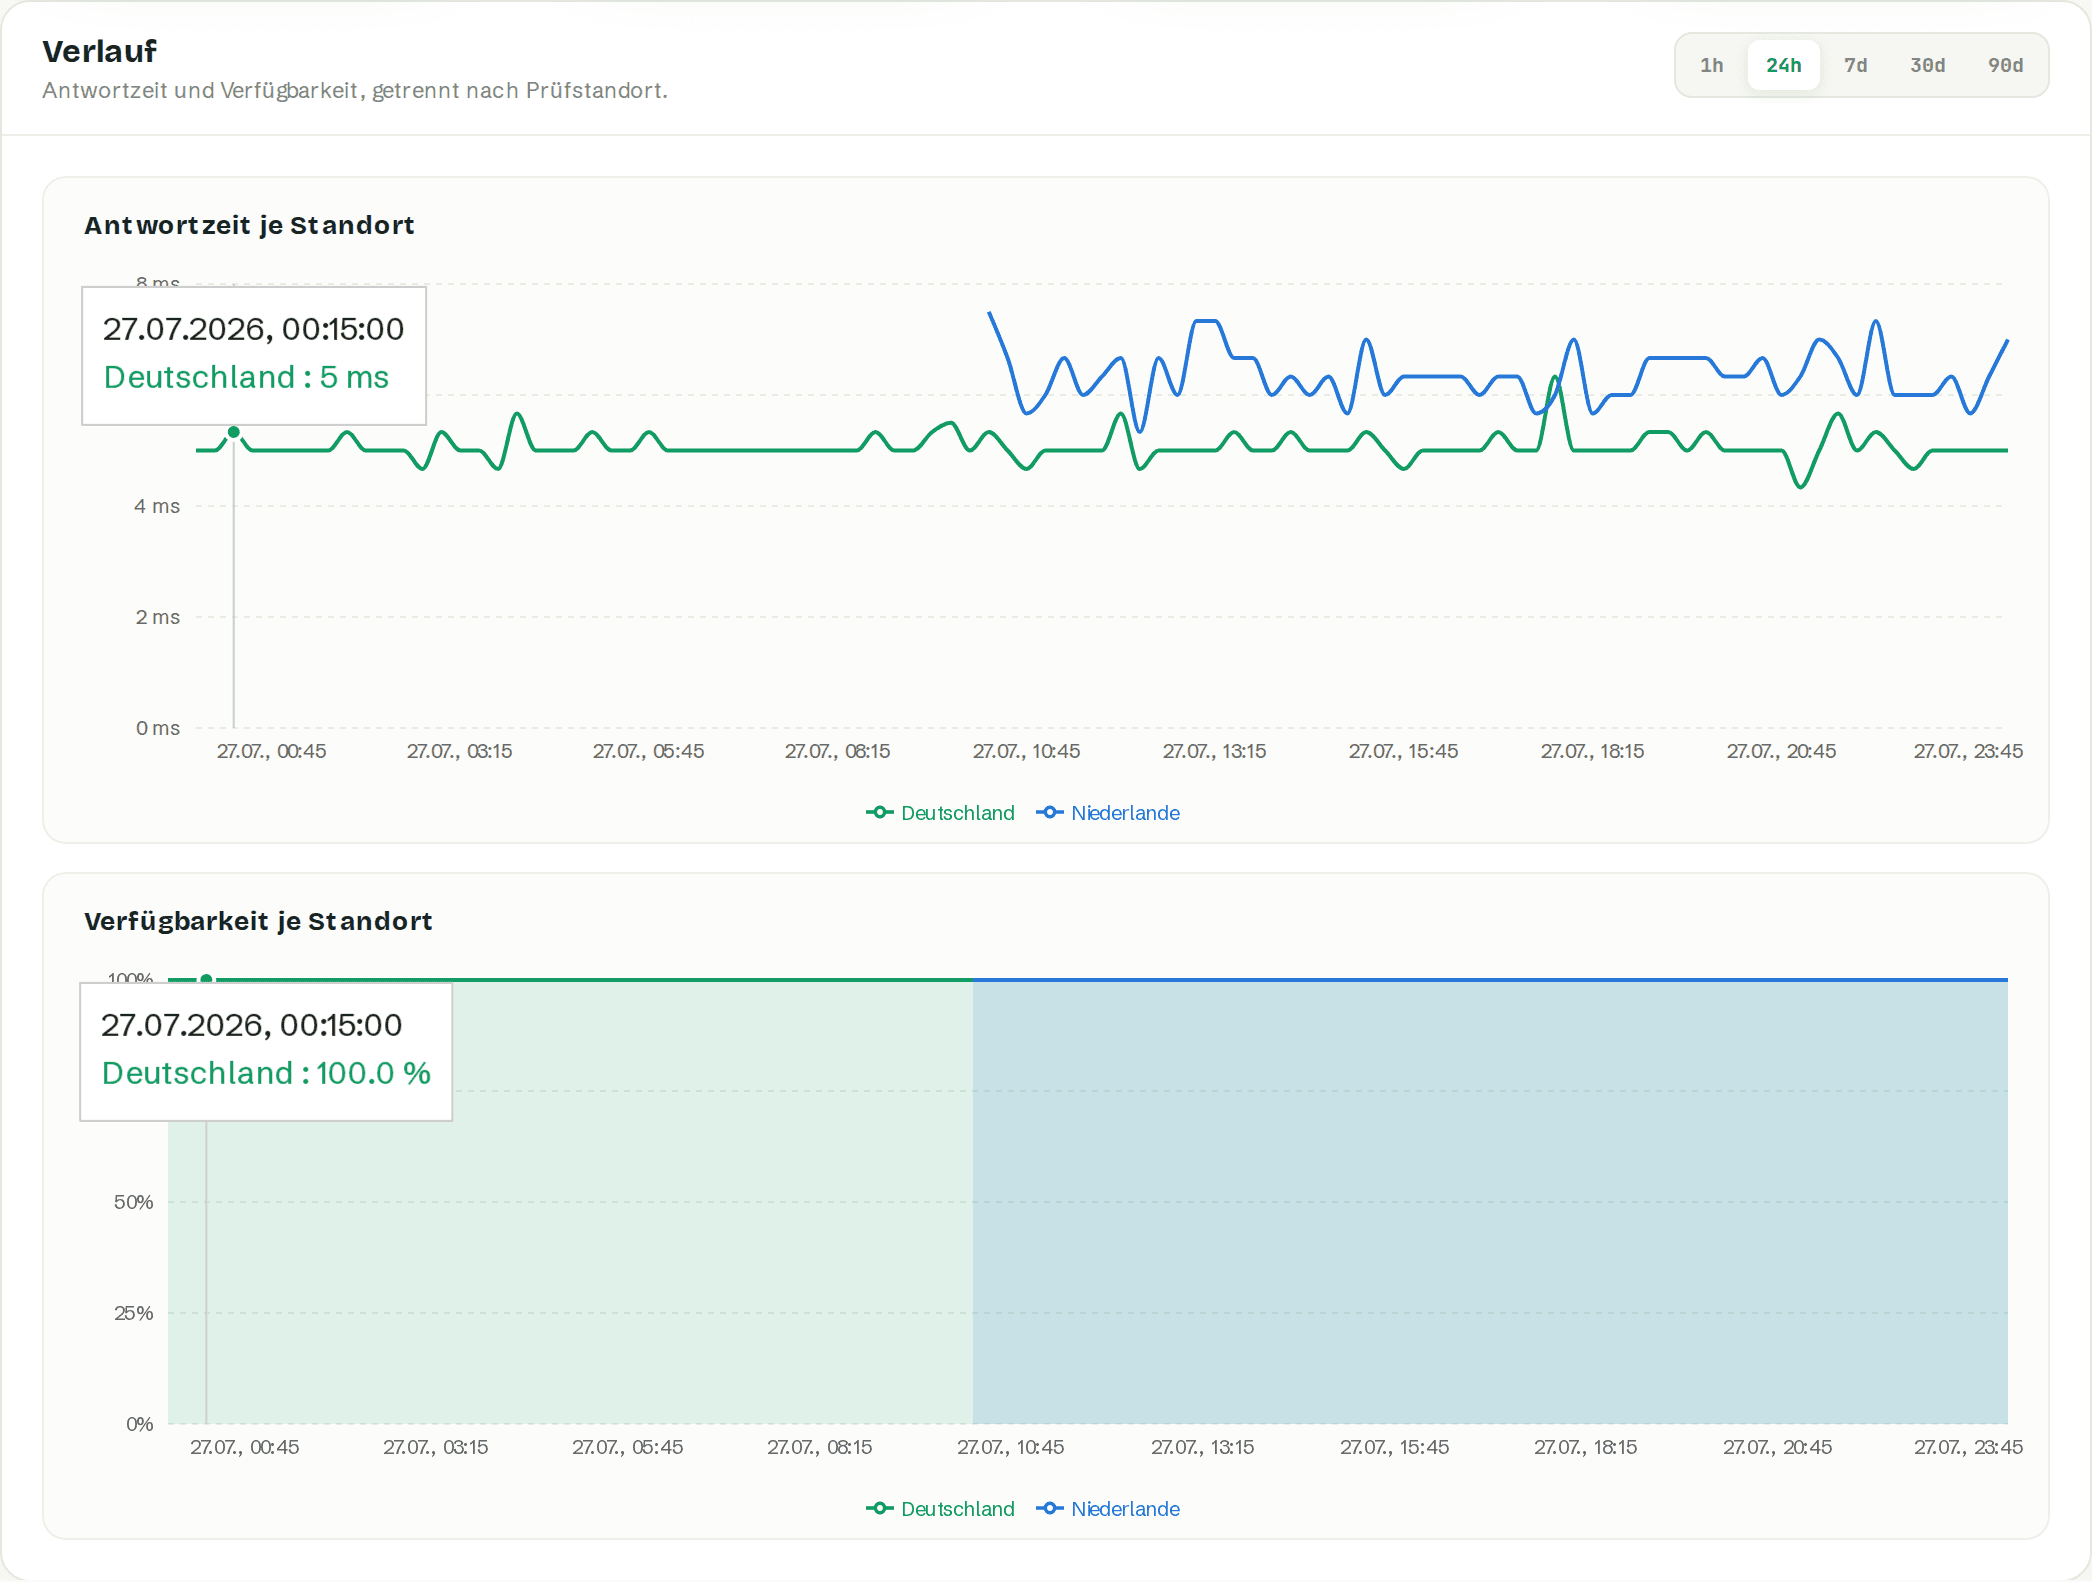
One monitor, several countries, one incident per location.
A service can be reachable from Frankfurt and dead from Tokyo — routing, geoblocking, a broken peering. You pick the locations per monitor; each one measures independently, with its own schedule, status and incident.
The notification names the place: “Shop @ Tokyo is unreachable”. Whoever is on call knows immediately whether it burns regionally or globally.
If one location fails, the incident stays scoped to it. When it recovers, only that incident closes — the other locations keep measuring.
A location silent for 90 seconds drops out of the aggregate status. An outage on our side must never look like yours.
If an assignment goes away, the location pool takes over automatically. No monitor goes silent because a location is under maintenance.
One command, and the host registers itself.
The agent is a single Go binary with no runtime, no open port and no inbound connection. It collects locally and pushes the result outward — through any firewall that allows outbound HTTPS.
CPU per core, memory and swap, load, filesystems including inodes, block devices, network interfaces, temperature sensors and the top processes.
Utilisation, memory, temperature, power draw and fan for NVIDIA and AMD cards — for render and AI nodes.
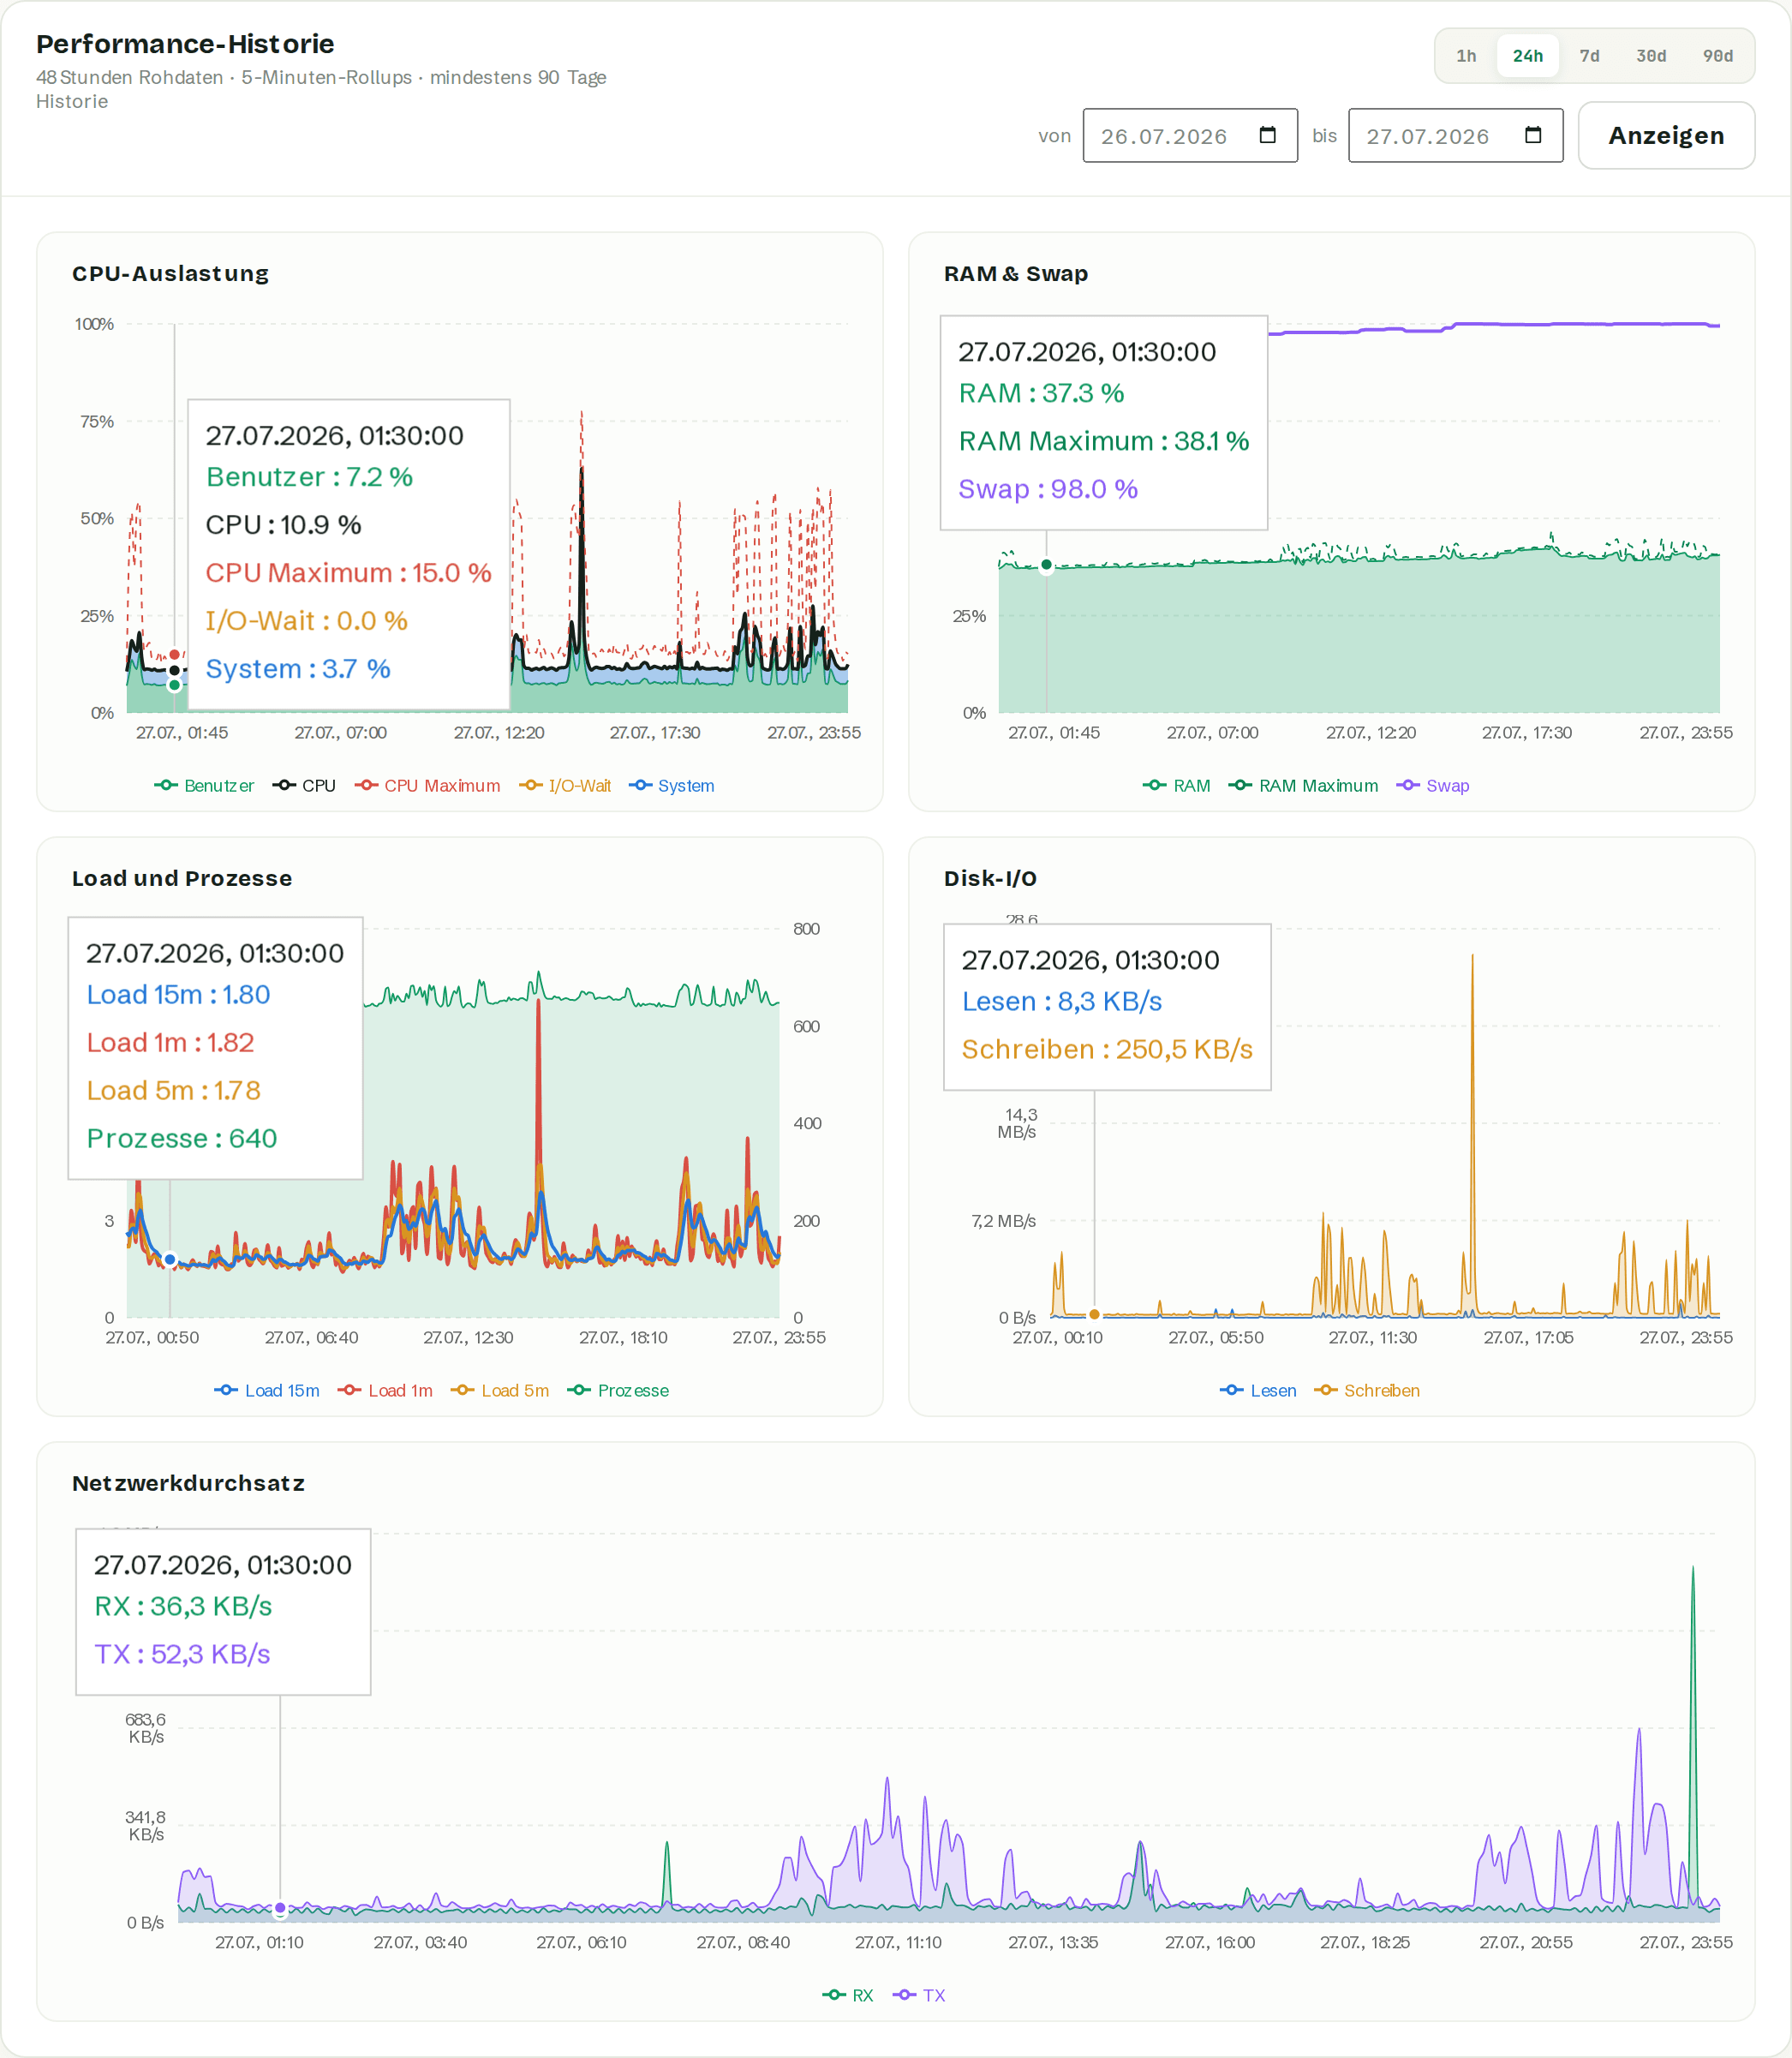
High-resolution raw values, then aggregates for months. The charts stitch both together, with a free date range.
systemd service or scheduled SYSTEM task, amd64 and arm64 — installed with one pasted command.
Warning and critical kept apart — per object, not per server.
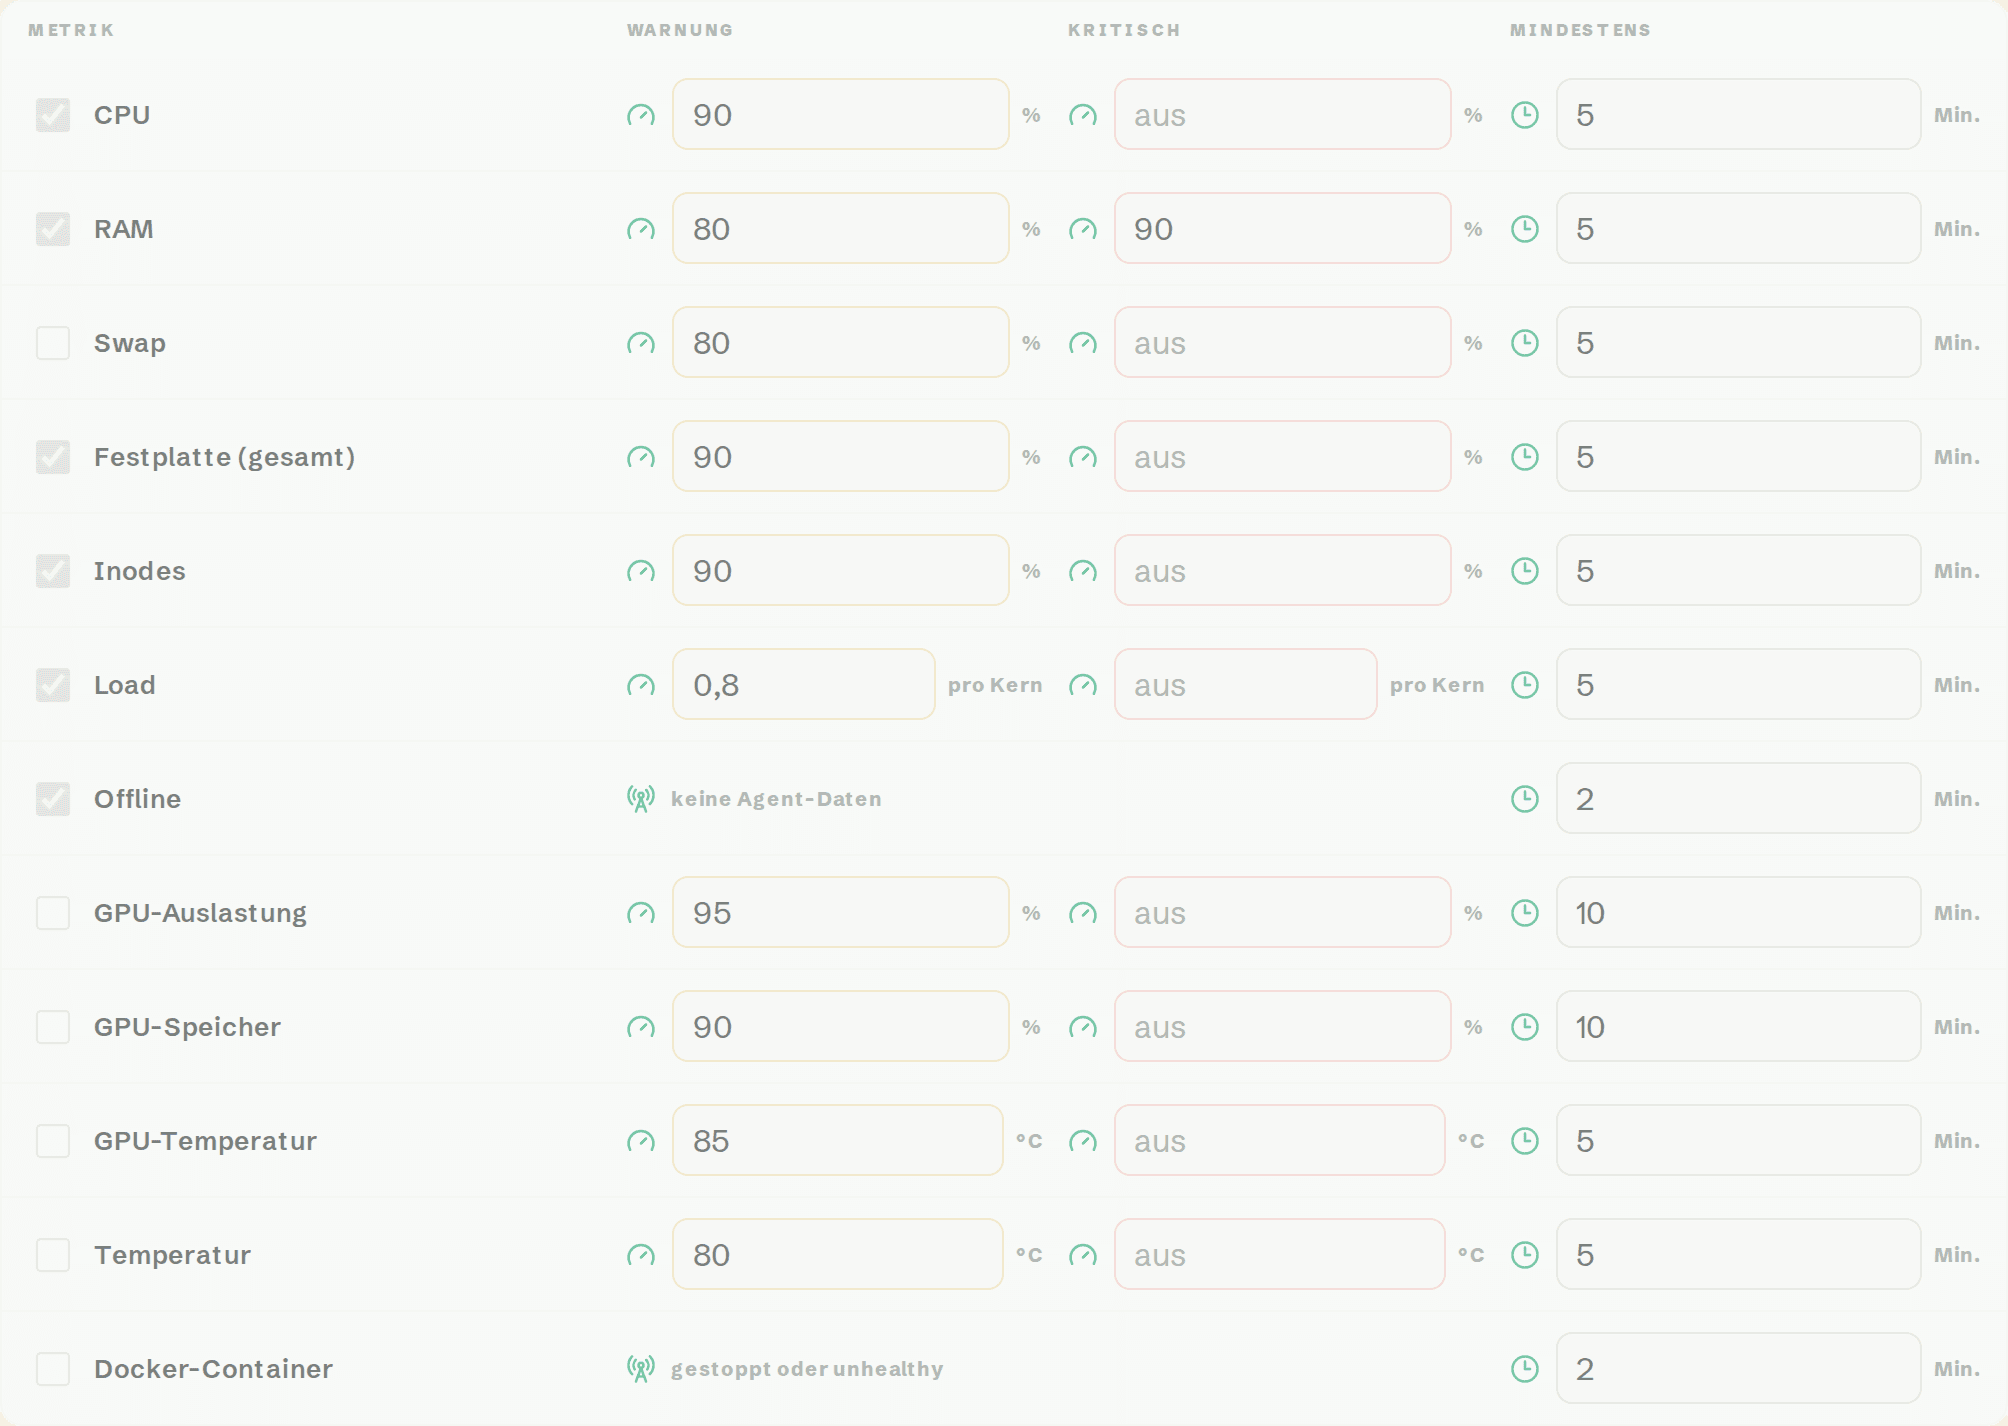
A single threshold forces a choice between too early and too late. Uptimo separates warning and critical per rule, with minimum duration, recovery time and repeat interval — a value oscillating around the threshold does not produce an alert storm.
Filesystems, GPUs, sensors and containers alert individually. A full /var never masks a filling /data.
90 % of 4 TB is not a problem, 90 % of 20 GB is. Next to the percentage there is a minimum amount of free space — plus overrides per mountpoint or device.
A firing warning that reaches critical sends an escalation. The way back stays quiet until recovery.
Email, SMS, webhook, Slack, Teams and Telegram — every delivery logged.
Your domain, your logo, no vendor branding.
A status page takes load off support when it looks like your product. Your domain, an uploaded logo, your brand colour — and the “powered by” line can be switched off, at no extra charge.
Drag components into groups — by product, region or criticality. Order and assignment are one gesture.
Notices with an impact level and the familiar flow from investigating to resolved. Every status change appends an update.
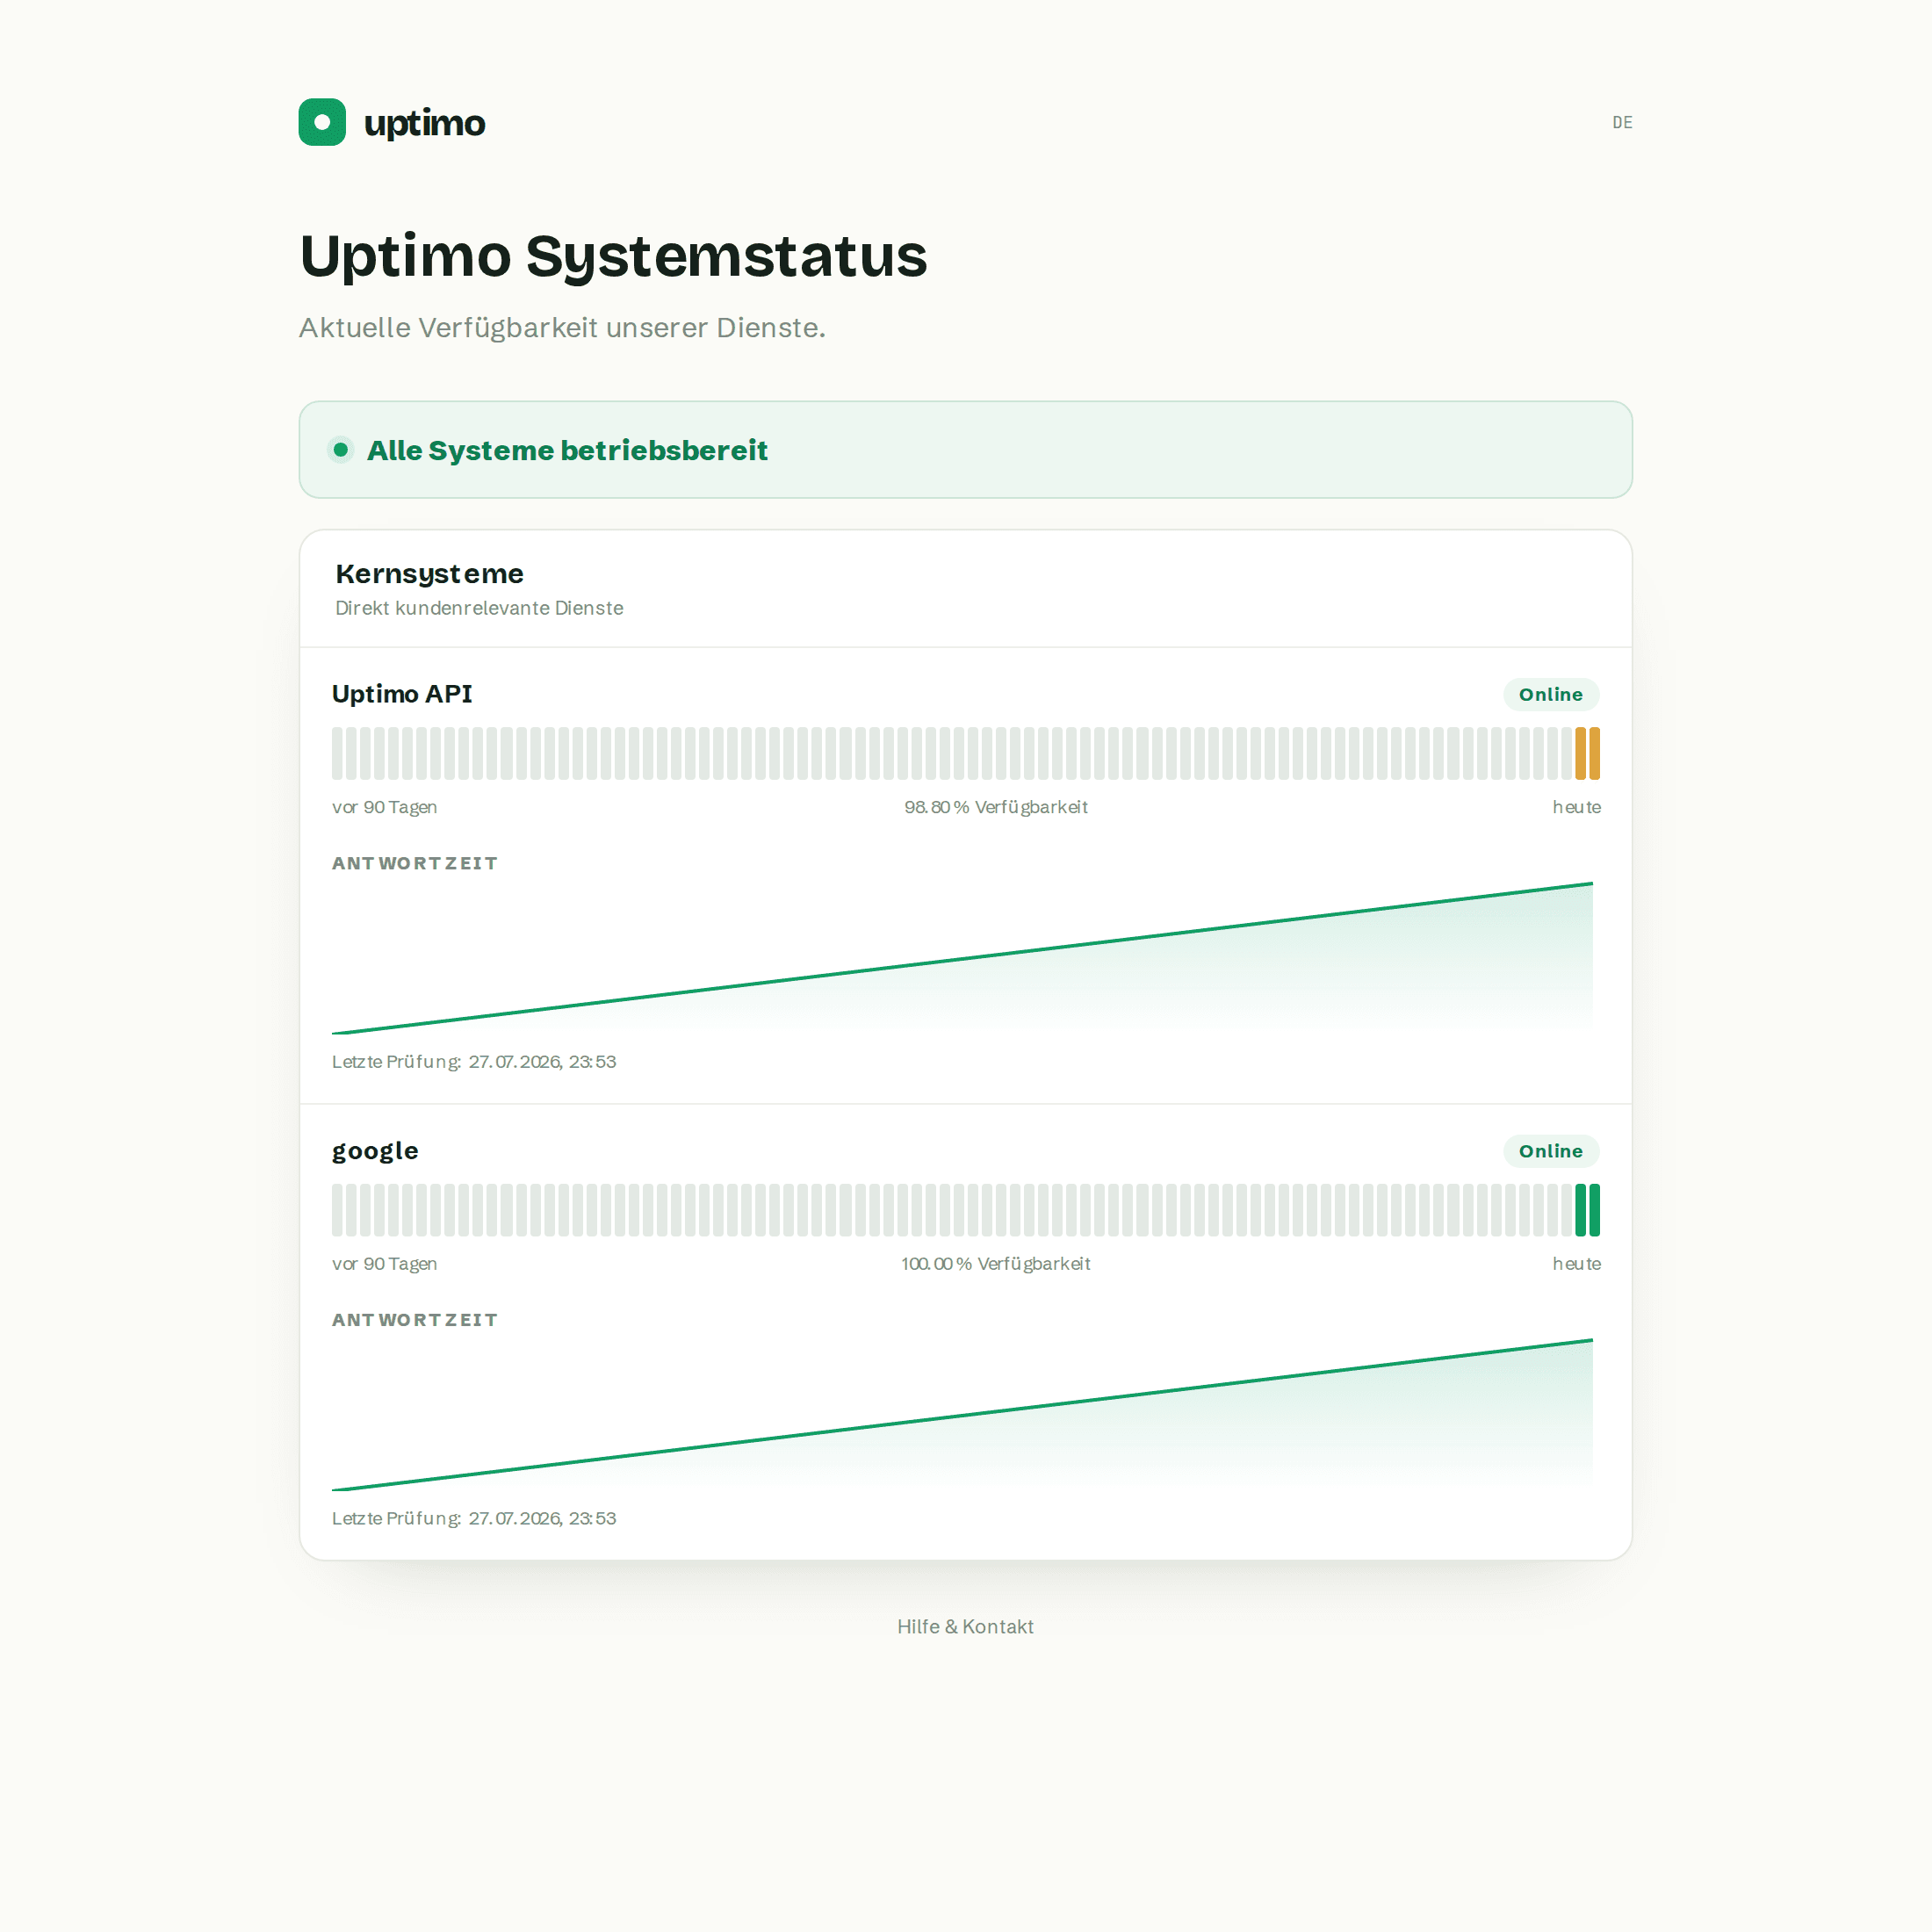
One bar per day over 30, 60 or 90 days. Days without measurements stay grey rather than green — only what was measured is claimed.
Show latency if you want it. Leave it off if availability is the whole story.
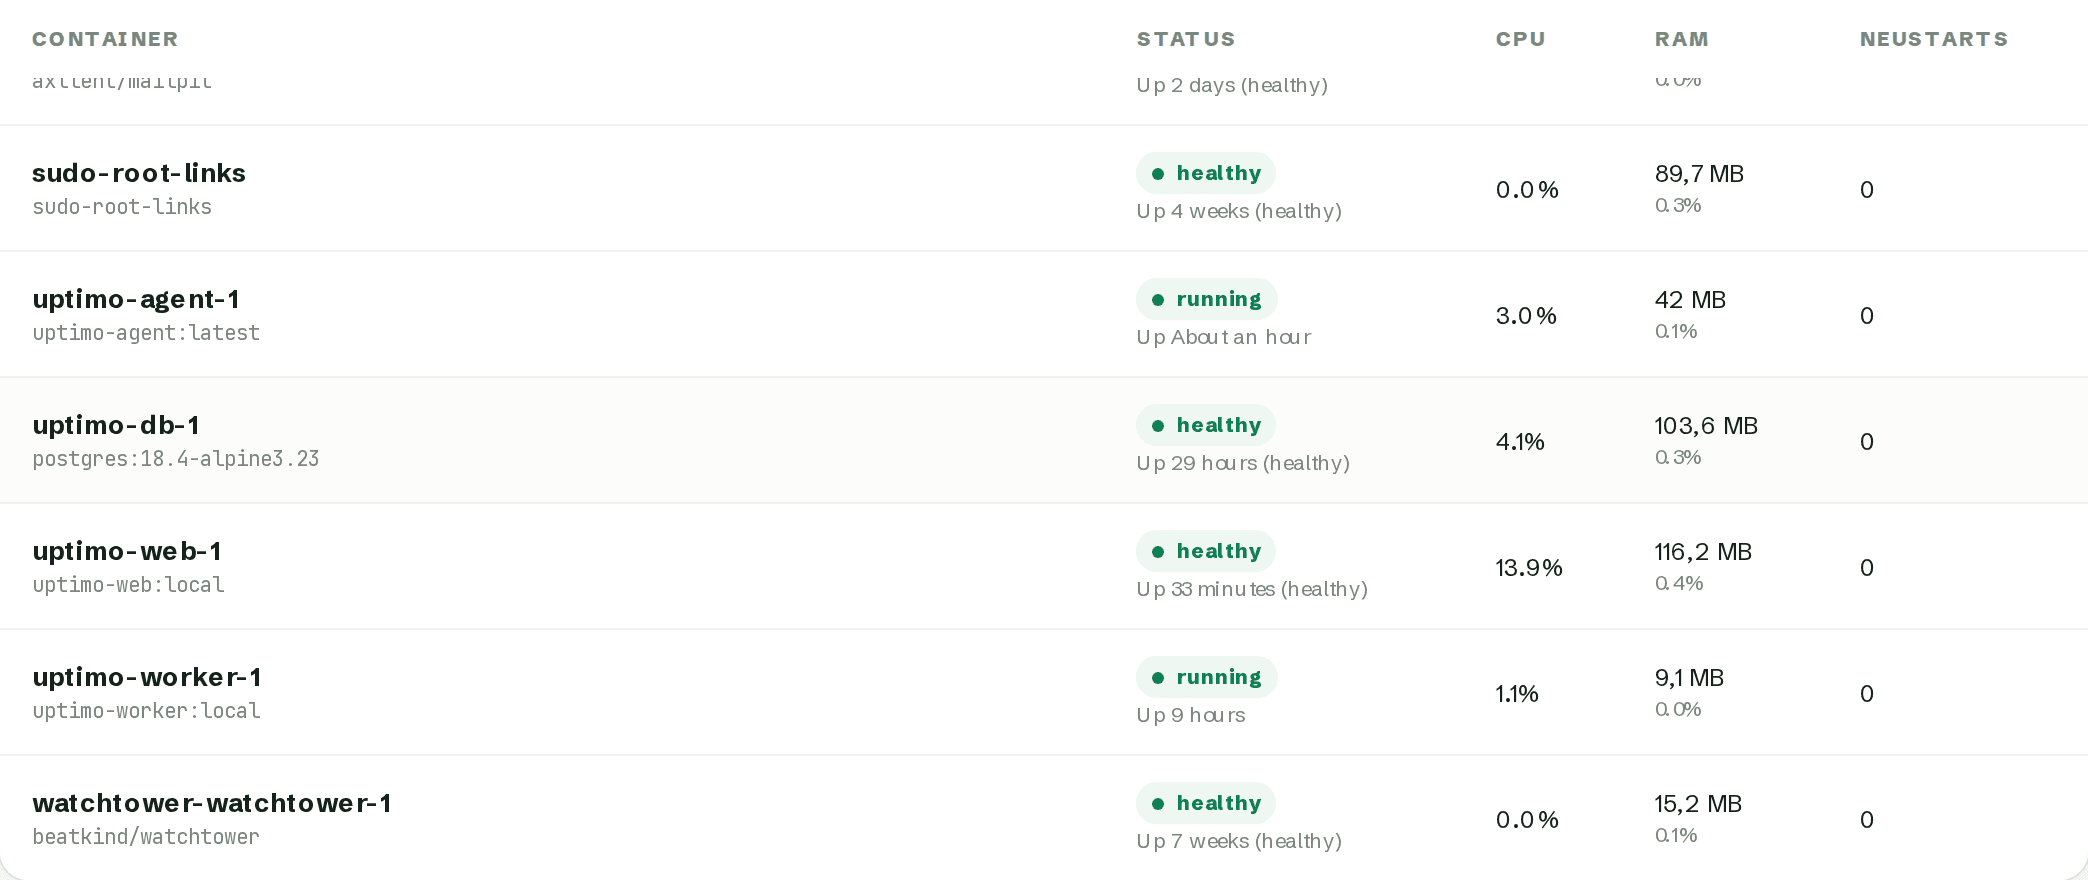
Containers with state, health and restart count.
The agent reads the container list straight from the Docker socket — no second agent inside the container, no sidecar. The socket is mounted read-only and is explicitly opt-in.
State, health check, restart count, image, CPU, memory and network throughput.
Two levels: wobbling (restarting, paused, health still starting) and down (exited or unhealthy).
Docker cannot say whether a stopped container was stopped on purpose. The rule is opt-in.
Container CPU is derived from two agent samples instead of blocking the daemon for a second per container.